
Summarize this with
 ChatGPT
 Claude
 Gemini
 Perplexity
TL;DR: Across 11,963,934 comments on 5,562 brand accounts measured over 18 months, 76.5% received no reply, no hide and no delete. Paid posts attract 2.5x the negative comments of organic ones while carrying only 12% of volume. Comment hostility is flat across the day: there is no quiet window. Brands running comment automations action 27% of comments against 8% for brands that do not.
Every figure above is our own measurement, not a survey and not a sample. The sections below give each one its denominator, its window and its caveats.
The Comment Benchmark Report 2026
11.9 million comments across 5,562 brand accounts, measured over 18 months. Eight pages with every figure on this page, plus the methodology and the findings we deliberately did not publish.
- Why paid posts attract 2.5x the negative comments
- Platform benchmarks: YouTube, Facebook, TikTok, Instagram, Google
- What brands running automations do differently
PDF, 8 pages, free. No credit card.
The public half of this page draws on the EU's DSA Transparency Database, which since 2023 has required every large platform to file a record of each moderation decision it takes. Platforms filed 1,109,746,815 decisions in the 50 days to 23 July 2026, a median of 263 every second, about 42% of them fully automated. That tells you what platforms do. It says nothing about what happens on an individual brand account, which is the gap this page fills.
Moderation volume in 2026
The EU's DSA Transparency Database is a live public register. Every provider of an online platform operating in the EU must submit a "statement of reasons" for each content moderation decision it takes, and the Commission publishes a daily index of those submissions.
We counted every daily filing in that index across 50 consecutive days, 4 June to 23 July 2026:
- 1,109,746,815 decisions filed in total across the 50 days
- 22,723,083 decisions on a median day - about 263 every second
- Busiest day: 50,362,307 on 9 July 2026
- Quietest day: 11,949,976 on 21 June 2026
- The busiest day carried 4.2x the volume of the quietest
(Source: replient.ai analysis of the EU DSA Transparency Database daily index, retrieved 24 July 2026)
Two things stand out. First, volume is rising: the 50-day mean of 22.2 million per day runs about 29% above the 17.2 million daily average across the database's most recent 180-day window. Second, daily volume is far more volatile than any annual figure suggests - a 4.2x swing between the quietest and busiest day inside seven weeks.
For the wider frame, the live register currently reports:
- 3,100,150,483 statements of reasons over the most recent 180-day window - an average of 17,223,058 per day, or 199 every second. (Source: EU DSA Transparency Database, 2026)
- 357 platforms are currently reporting. (Source: EU DSA Transparency Database, 2026)
- A single 24-hour sample on 31 July 2024 contained 57.4 million decisions - 664 per second, well above today's median, which shows how much these rates move. (Source: ITIF, 2025)
Which platforms moderate the most
The Commission's daily index publishes totals, not a per-platform split. The most rigorous public breakdown remains the peer-reviewed audit of the database's first 100 days (25 September 2023 - 2 January 2024) - so read this section as the baseline the 2026 volumes above grew out of, not as today's market shares.
On that baseline, moderation volume was wildly unequal and did not track platform size. TikTok filed more statements of reasons than every other major platform combined.
- TikTok: 184.772 million statements of reasons, 52.33% of the total
- Facebook: 79.050 million, 22.39%
- Pinterest: 60.297 million, 17.08%
- YouTube: 19.267 million, 5.46%
- Instagram: 8.111 million, 2.30%
- Snapchat: 1.119 million, 0.32%
- X: 0.466 million, 0.13%
- LinkedIn: 0.038 million, 0.01%
(All figures: Drolsbach and Pröllochs, arXiv, 2024)
The LinkedIn-to-TikTok ratio is roughly 1 to 4,862. Some of that is genuine difference in content risk. Some of it, as the section on data quality below shows, is a difference in what platforms choose to report.
Comments are the largest moderation surface
Most public discussion of moderation focuses on posts and videos. The data says the bulk of the work is in text - which on a brand account means the comment section.
- TikTok removed 237,517,128 comments globally in Q1 2026, up from 218,793,572 in Q4 2025 - an increase of about 8.6% in one quarter. (Source: TikTok Community Guidelines Enforcement Report Q1 2026)
- In the same quarter TikTok removed 184,012,576 videos, about 0.5% of everything uploaded. (Source: TikTok, Q1 2026)
- More comments were removed than videos - a ratio of about 1.29 comments for every video. (Derived from TikTok, Q1 2026)
- 55.5% of TikTok's statements of reasons concerned text content; only 33.5% concerned video. (Source: Drolsbach and Pröllochs, arXiv, 2024)
- TikTok removed 86,288,705 fake accounts and 25,764,372 accounts suspected of belonging to underage users in Q1 2026. (Source: TikTok, Q1 2026)
- Using automated detection, TikTok has prevented over 2 billion spam accounts from being created. (Source: TikTok, 2024)
If you run a brand account, this is the part that matters: the volume problem is not your posts, it is what appears underneath them.
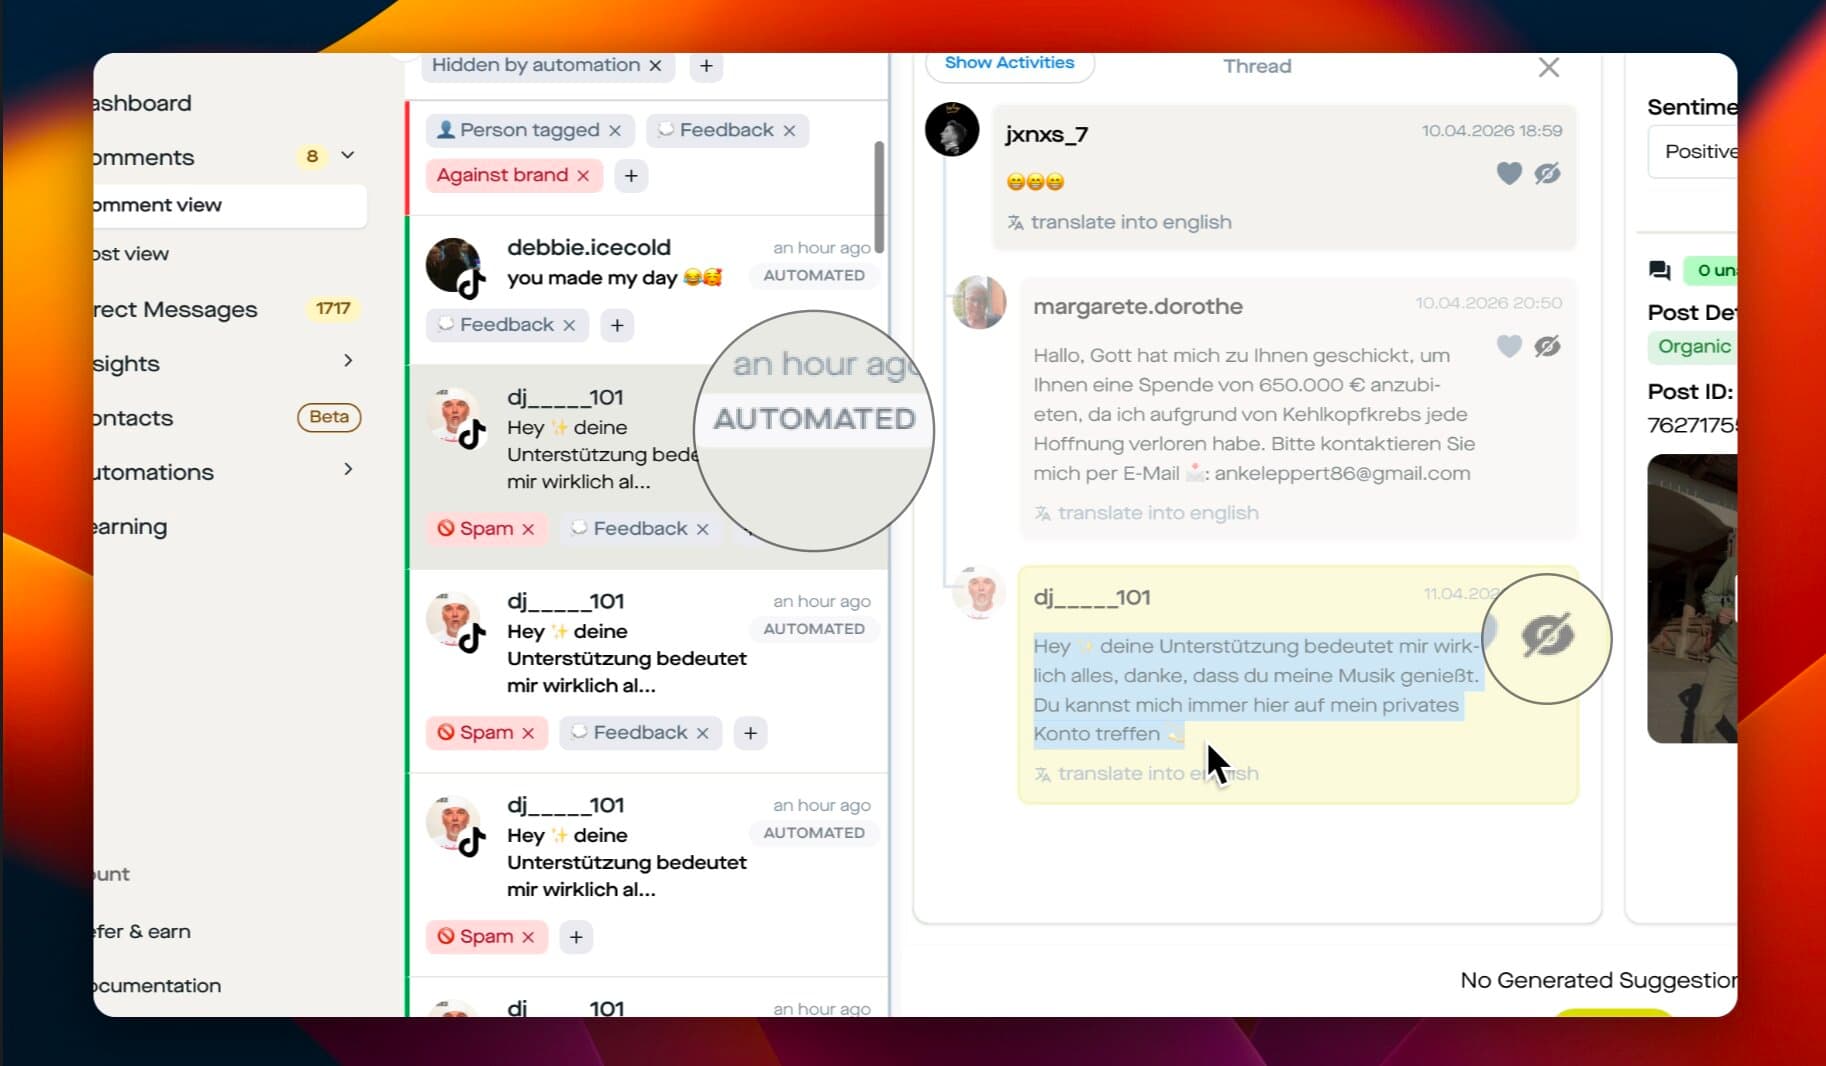
The pattern above is what the aggregate numbers look like at account level: the same spam comment posted repeatedly under one video, plus a scam message written to look like a personal appeal. Neither violates a platform guideline clearly enough to be removed centrally, which is why both survive platform-side enforcement and land in the brand's own queue.
How much of moderation is automated
- Approximately 42% of all decisions in the database are fully automated. (Source: EU DSA Transparency Database, 2026)
- In a 24-hour sample, 97% of content detection was automated. (Source: ITIF, 2025)
- More than 50% of content removal decisions in that sample were fully automated - no human in the loop. (Source: ITIF, 2025)
- TikTok reported 92% of its decisions as fully automated. (Source: arXiv, 2024)
- YouTube reported 28%; LinkedIn about 15%. (Source: arXiv, 2024)
- Over 80% of the violative videos TikTok removed were taken down by automated technology. (Source: TikTok, 2024)
- Over 96% of content removed by TikTok's automation was taken down before it had any views. (Source: TikTok, 2024)
- Over 98% of TikTok's removals happened within 24 hours. (Source: TikTok, 2024)
- TikTok applies its rules in over 70 languages. (Source: TikTok, 2024)
What platforms actually do to content
Removal is the exception, not the rule. The most common outcome is that content stays online but stops being shown.
- Visibility restrictions: 79.33% of all decisions
- Account restrictions: 17.58%
- Provision restrictions: 3.09%
- Monetary restrictions: 0% - not a single platform submitted one
(All figures: Drolsbach and Pröllochs, arXiv, 2024)
There is one clear exception: for illegal or harmful speech, over 98% of decisions resulted in full removal rather than a visibility restriction. (Source: ITIF, 2025)
This distinction matters commercially. A comment that has been visibility-restricted is invisible to the platform's other users but often still visible to its author, who has no idea they have been actioned - and still visible in your brand's own notifications.
How fast decisions are applied
Speed varies by two orders of magnitude between platforms.
- X applied 100% of its decisions on the same day the content was created. (Source: arXiv, 2024)
- TikTok applied 89% of decisions the same day. (Source: arXiv, 2024)
- LinkedIn applied 89.8% within seven days. (Source: arXiv, 2024)
- Pinterest took more than 30 days for 70.8% of its decisions. (Source: arXiv, 2024)
- YouTube took more than 30 days for 70.7%. (Source: arXiv, 2024)
- TikTok's own reporting delay to the database grew from same-day to about 8 days over the study period. (Source: arXiv, 2024)
- In Q1 2026, TikTok removed 94.4% of flagged content within 24 hours, with a 99.3% proactive removal rate. (Source: TikTok, Q1 2026)
- TikTok reinstated 8,838,710 videos after review in Q1 2026. (Source: TikTok, Q1 2026)
That last figure is worth sitting with: roughly 4.8% of removed videos were put back, which is a useful public benchmark for how often automated moderation gets it wrong.
The transparency gap nobody talks about
This is where the dataset stops being a scoreboard and starts being an argument. Independent audits found that platforms' self-reported numbers frequently contradict their own transparency reports.
- Facebook and Instagram submitted 0% fully automated decisions, despite their transparency reports describing heavy automation. (Source: arXiv, 2024)
- LinkedIn submitted about 15% automated, while its transparency report claimed 99% - an 84-point gap. (Source: arXiv, 2024)
- TikTok showed a 50-percentage-point discrepancy between the automation rate in its report (45%) and in its submissions (95%). (Source: arXiv, 2024)
- X submitted 466,400 statements of reasons against the 2.05 million moderation actions claimed in its own transparency report. (Source: arXiv, 2024)
- Nearly 90% of statements of reasons fall into the catch-all category "scope of platform service", too vague for meaningful analysis. (Source: ITIF, 2025)
- The database contains no field indicating whether content was removed under a platform's own terms or under European law. (Source: ITIF, 2025)
- A machine-readable API only became available in February 2025, more than a year after launch. (Source: ITIF, 2025)
The honest reading: the DSA database is the best public data on moderation that has ever existed, and it is still not good enough to compare platforms like for like. Any statistic that ranks platforms against each other - including the chart above - is partly measuring reporting behaviour rather than moderation behaviour.
What public data cannot show: inside brand comment sections
Everything above measures what platforms do. None of it says what happens on an individual brand's account - whether anyone replied, whether a comment was ever dealt with at all. No platform reports that, and no regulator requires it.
We measured it directly. Across 11,963,934 comments on 5,562 brand accounts over 18 months (January 2025 to June 2026), on eight platforms:
- 76.53% received no reply and no moderation action of any kind. Not answered, not hidden, not deleted.
- 8.97% received a reply.
- 10.80% were hidden.
- 5.07% were deleted.
- 21.53% of classified comments carried negative sentiment.
In the most recent month measured, June 2026 - 2,062,819 comments across 2,260 active brands - the share receiving no action at all was 80.86%.
(Source: replient.ai platform data, January 2025 - June 2026)
That first number is the one worth sitting with. Platform enforcement removed 237 million comments from TikTok in a single quarter - and on the average brand account, roughly four in every five comments are still simply left where they landed.
Two patterns hold up across the whole dataset.
YouTube comment sections are the most hostile by a wide margin. A third of classified YouTube comments on brand accounts were negative - 2.7 times Instagram's rate. If you run the same campaign across both, you are not running it into the same room.
Facebook and TikTok get hidden three times more often than Instagram. 11.00% of Facebook comments and 10.61% of TikTok comments were hidden, against 3.08% on Instagram.
| Platform | Comments | Brands | Negative (of classified) | Hidden | No action |
|---|---|---|---|---|---|
| 902,396 | 1,193 | 21.14% | 11.00% | 82.3% | |
| 595,151 | 1,320 | 12.09% | 3.08% | 86.7% | |
| TikTok | 371,986 | 699 | 18.48% | 10.61% | 83.3% |
| YouTube | 180,774 | 512 | 33.16% | 0% | 91.5% |
| Google Reviews | 9,794 | 252 | 8.61% | 0% | 80.2% |
| 1,972 | 115 | 20.06% | 0% | 91.0% |
The 0% figures measure hiding specifically, and hiding is not the mechanism brands use on every platform - on YouTube, for example, deletion is the tool, and deletions are tracked separately from the hide flag. So the "Hidden" column understates total moderation activity wherever deletion is the normal route, and the "No action" column for those platforms should be read as an upper bound rather than a settled figure.
Paid posts attract 2.5x the negative comments organic posts do
This is the finding with the clearest commercial consequence, and it is not in any public dataset. We split every comment by whether it landed on a paid post or an organic one.
Paid posts carried 12.1% of all comment volume but 36.3% of every negative comment - a threefold over-representation. The effect held in all five brand cohorts we tested separately, ranging from 1.9x to 2.9x, so it is not one large advertiser distorting the average.
The mirror image is just as stark: organic posts were 1.8x more likely to attract positive comments.
There is a plain reading here. Paid distribution puts a brand in front of people who did not choose to follow it, and that audience responds differently. The moderation load a campaign creates is not proportional to its reach - it is worse than proportional.
Comment hostility is flat across the day
We expected to find that hostile comments cluster overnight, when no one is staffed. Measured across every comment on all 5,562 brand accounts in June 2026, that turns out not to be true.
- Volume peaks at 18:00 and troughs at 04:00, a swing of 2.16x.
- Negative sentiment stays between 15.9% and 20.8% of classified comments at every hour of the day.
- The most hostile hour is 13:00 (20.77%), not the small hours. Overnight, 01:00 to 08:00, runs 17.66%, slightly below the 10:00 to 17:00 daytime figure of 19.59%.
- Reply rates are flat too: 8.06% overnight against 8.16% in business hours.
This is a negative result and we are reporting it as one. An earlier draft of this page, based on a 1,200-brand subsample, claimed the opposite: that negativity peaked at 04:00 while reply rates collapsed. Re-running the same query across all 5,562 brands reversed it. The subsample was not random, because brand IDs order by cohort age, and the effect disappeared once the full population was measured.
The useful conclusion is duller but more actionable: there is no quiet window. Comment load never falls below 2.5% of the day's volume in any hour, and hostility does not concentrate anywhere you could staff around. A moderation approach that covers business hours is missing a constant, evenly distributed load, not an overnight spike.
How this was measured, and what we are deliberately not claiming. All comments received on brand accounts using replient.ai between 1 January 2025 and 30 June 2026, excluding the brands' own replies - 11,963,934 comments across 5,562 brands. These are counts of every qualifying comment, not a sample. "No action" means a comment that was neither replied to, hidden, nor deleted. The platform table, the paid-versus-organic split and the hour-of-day distribution all cover June 2026, the most recent complete month. The paid/organic comparison covers all 5,562 brands, aggregated from ten separate brand cohorts; the per-platform split does too. Two independent chunkings of the population returned identical totals, which rules out gaps or double counting. Platforms with fewer than five active brands are excluded.
Sentiment is AI-assigned, and coverage moved substantially across the period - from 29% of comments in January 2025 to 75% in December 2025 and 50% in June 2026. Every sentiment figure here is therefore a share of classified comments, never of all comments.
One finding we could have published from this data and did not. Sentiment appears to improve over the 18 months, from 44% negative to 19% - but classification coverage changed so much across the same window that the trend cannot be separated from the measurement, so it would not be a finding.
We also do not report volume as a time series. The set of brands contributing data changed over the period, so any month-on-month movement would describe the composition of the sample rather than anything about social media. All volume figures on this page are therefore stated for a single stated window, never as a trend.
What this means if you manage a brand account
Three practical conclusions follow from the data.
Automation is already the norm, not the future. At 42% fully automated across the database and 97% automated detection in sampled data, the question is no longer whether machines moderate comments. It is whether your comment section is covered by the same standard the platforms apply to their own.
Platform moderation does not protect your brand. Platforms enforce their own community guidelines - spam, hate speech, illegal content. They do not remove a competitor's link drop, an unanswered pricing question, or a customer complaint decaying under your ad. Everything in the 79.33% "visibility restriction" bucket is invisible to the platform's users but still sitting in your notifications.
Comment volume outpaces video volume. TikTok alone removed 1.29 comments for every video in Q1 2026, and comment removals grew 8.6% in a single quarter. Any moderation approach built around reviewing posts rather than replies is scaled to the wrong number.
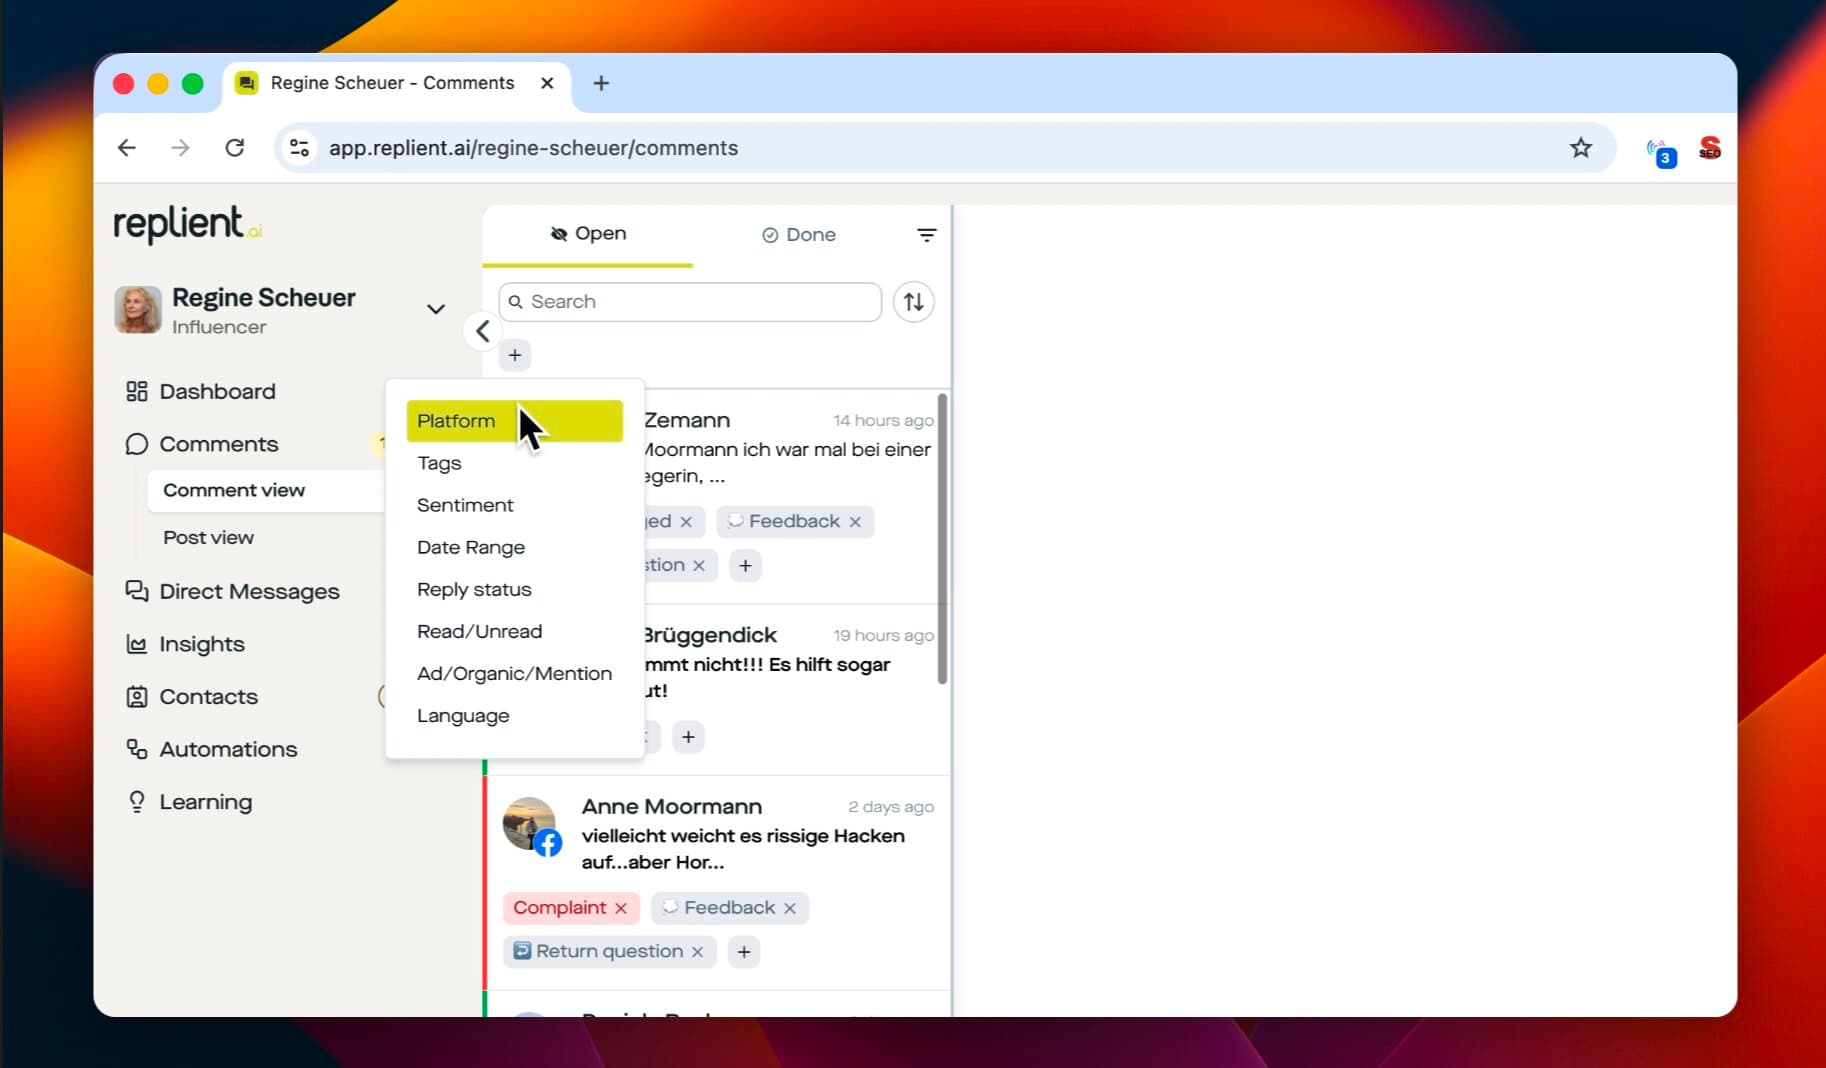
The categories that matter commercially - complaint, question, feedback, ad versus organic - are not the categories platforms enforce on. Platform moderation asks "does this break the rules?" A brand has to ask "does this cost a sale?", and those two questions sort the same comment section very differently.
If you want the metrics side of this, our breakdown of comment KPIs covers what to measure once moderation is running.
Methodology and sources
Every figure on this page comes from one of five sources, each consulted directly:
- EU DSA Transparency Database (European Commission) - live public register of moderation decisions filed under the Digital Services Act. Register-level figures and the daily submission index were retrieved on 24 July 2026. The 50-day totals, median, per-second rates and the daily chart are our own count of every entry in that index for 4 June - 23 July 2026; the Commission publishes the daily figures but not this aggregation.
- Drolsbach and Pröllochs, arXiv (2024) - peer-reviewed audit "The DSA Transparency Database: Auditing Self-reported Moderation Actions by Social Media", covering 353.12 million statements of reasons from 25 September 2023 to 2 January 2024.
- ITIF (2025) - "EU Should Improve Transparency in the Digital Services Act", published 20 October 2025, analysing a 57.4 million-decision sample from 31 July 2024.
- TikTok Community Guidelines Enforcement Report, Q1 2026 - covering January to March 2026.
- replient.ai platform data (June 2026) - all comments received on brand accounts using replient.ai, 11,963,934 comments across 5,562 brands and eight platforms, Jan 2025 - Jun 2026. Counts, not samples. Sentiment is AI-assigned with 49.9% coverage, so sentiment shares are of classified comments.
- TikTok Transparency Center (2024) - platform-reported automation and enforcement figures.
Where a figure is labelled "derived", it is arithmetic performed on two published numbers, both of which are stated alongside it. Percentages are reproduced exactly as published and not rounded. Figures from 2024 are labelled with their year rather than presented as current, because platform enforcement volumes change quarter to quarter.
This page is updated when new quarterly enforcement reports and database snapshots are published.
About the author

Co-Founder, replient.ai
Thomas is a co-founder of replient.ai and works on AI-assisted comment management for social media. He writes about automation, community management and efficient comment moderation for growing brands.